0259 - Local Food Survey - SSA - 2025 - June 3, 2025
0259 - Local Food Survey - SSA - 2025 - June 3, 2025.docx
Local Food Marketing Practices Survey
OMB: 0535-0259
Supporting Statement – Part A
LOCAL FOOD MARKETING PRACTICES SURVEY
OMB No. 0535-0259
In an effort to increase the transparency of NASS's survey processes and provide information on the quality of its estimates, NASS publishes Methodology and Quality Measures Reports for some surveys. The Methodology and Quality Measures Reports are published at around the same time or shortly after estimates are released.
This supporting statement incorporates data and methodology from the Local Food Marketing Practices Survey Methodology and Quality Measures Publication located at: https://www.nass.usda.gov/Publications/AgCensus/2017/Online_Resources/Local_Food/quality_measures/2020_FMPS%20Methodology.pdf
The National Agricultural Statistics Service (NASS) is seeking approval to conduct a reinstatement of an information collection to gather data related to the production and marketing of foods directly from farm producers to consumers, institutions, or to retailers who then sell directly to consumers, and intermediate markets who sell locally or regionally branded products. A sample of operations will be drawn from the NASS List Frame. The Local Food Marketing Practices Survey (LFMPS) will be conducted in early 2026, referencing the calendar year of 2025.
The LFMPS is a follow-on to the Census of Agriculture that is conducted every five years and was last completed for the 2020 calendar year (2017 Census of Agriculture). There are no significant changes to the methodology or procedures from what was conducted in 2021 for the 2020 calendar year (2017 Census of Agriculture).
A. JUSTIFICATION
1. Explain the circumstances that make the collection of information necessary. Identify any legal or administrative requirements that necessitate the collection. Attach a copy of the appropriate section of each statute and regulation mandating or authorizing the collection of information.
The information to be gathered in the Local Food Marketing Practices Survey is vital to the USDA’s and the public’s understanding of the local foods sector, which in turn informs policymaking and program implementation. Section 10016(a) (1) (A) of the 2014 Farm Bill (P.L. 113-79) directs USDA to collect data on “the production and marketing of locally or regionally produced agricultural food products,” while Section 10016 (b) (2) requires the Department to “conduct surveys and analysis and publish reports relating to the production, handling, distribution, retail sales, and trend studies… of or on locally or regionally produced agricultural food products.” This survey fulfills those requirements.
Federal funding to the local foods sector has increased under the 2002 Farm Bill (P. L. 107-171), the 2008 Farm Bill (P.L. 110-246), the 2014 Farm Bill (P.L. 113-79), and the 2018 Farm Bill (P.L. 115-334). The 2002 bill created the Farmers Market Promotion Program (FMPP) and expanded the Value-Added Producer Grant program (VAPG) to include many activities that take place on farms producing local foods. The 2008 Farm Bill provided mandatory funding for FMPP and the Specialty Crop Block Grants Program (SCBGP), while creating a niche in the Business and Industry Loan Guarantee program for local foods enterprises. The 2014 Farm Bill expanded FMPP to include the Local Food Promotion Program (which focuses on local foods marketing channels that are not direct-to-consumer); expanded mandatory funding for VAPG, SCBGP, and Community Food Projects; and created the Food Insecurity Nutrition Incentives program, which expands local market opportunities for producers by providing incentives for low-income consumers to purchase local foods. In addition, significant policy support for local food systems also occurred with the institution of the USDA Know Your Farmer, Know Your Food Initiative (KYF2) in September 2009. KYF2 was designed to eliminate organizational barriers to improve coordination and availability of resources for the promotion of local food systems. The 2018 Farm Bill has provided funding for the continuation of the Local Food programs. The 2018 farm bill also provided support for urban, indoor, and other emerging agricultural production, creating new programs and authorities, and providing additional funding for such operations. Other programs that may support local food systems were authorized in the most recent child nutrition reauthorization (Healthy, Hunger-Free Kids Act of 2010, P.L. 111-296).
In 2020, farmers produced and sold $9.0 billion of edible food commodities directly to consumers, retailers, institutions, and a variety of local food intermediaries such as distributors and wholesalers that market and sell locally branded products. Consumers accounted for 33 percent of these direct food sales, and retailers accounted for 21 percent (https://www.nass.usda.gov/Publications/Highlights/2022/local-foods.pdf). Direct farm sales include both fresh foods and processed or value-added products such as, cheese, meat, jam, cider, wine, etc.
California, with $1.4 billion in direct farm sales, accounted for 16 percent of the U.S. total. At the regional level, the eleven northeastern states had the largest share of direct sales (28 percent). The seven-state southwestern region, of which California is part, had accounted for 23 percent of the U.S. total.
California also led the country in the number of farms selling food directly with 14,308 farms, which accounted for 10% of the U.S. total. Texas was the only other state with more than 10,000 farms selling directly. Regionally, the southwest and northeast had the most farms engaged in direct sales of food (25,644 and 26,707 farms, respectively).
The majority (57%) of farms marketing food directly were located in metropolitan counties. These farms accounted for 62% of all direct food sales. Approximately 78% of farms selling food directly sold all of their directly marketed food within a 100-mile radius of the farm.
In the 2022 Census of Agriculture, the value of direct sales increased to $14.2 billion from $9.0 billion in the 2017 Census of Agriculture. The 2025 LFMPS will show additional details about the changes in the sales and marketing practices, as well as provide details about the sector, including sales by channels, as well as by commodity type.
General authority for these data collection activities is granted under U.S. Code Title 7, Section 2204. This statute specifies that “The Secretary of Agriculture shall procure and preserve all information concerning agriculture which he can obtain ... by the collection of statistics ... and shall distribute them among agriculturists.”
2. Indicate how, by whom, and for what purpose the information is to be used. Except for a new collection, indicate the actual use the agency has made of the information received from the current collection.
The Local Food Marketing Practices Survey (LFMPS) is a renewal of a data collection that was conducted for the first time in 2016. The primary purpose of the Local Food Marketing Practices Survey is to measure growth and changes in this sector of the market since that initial benchmark survey. This survey will produce statistics on the number of operations that produce local foods, the value of local foods sales (in total and by specific marketing channel), and marketing practices and expenses. Farms in all 50 states will be asked to provide these data. NASS plans to release estimates at the national and regional or state levels, where publishable (due to disclosure limitations).
The LFMPS is valuable because local farms have different business models than conventional farms, and the LFMPS is able to discern important data that are otherwise unavailable from pre-existing farmer surveys. This includes details on different types of market channels used, information about on-farm value-added processing, and outreach and advertising directly to community members and shoppers. Food and agriculture economists and other researchers in university, government, and nonprofit sectors analyze and rely on the data in this survey to understand local food marketing practices, make programmatic decisions, and support farms and related food production, aggregation, and distribution businesses.
Because the survey gathers data on production, risk management, and marketing practices, it will be used by a number of USDA agencies and federal policymakers to inform their policies and programs. For example:
Farm Service Agency (FSA): Data from this survey will illustrate the use of the FSA Microloan Program (mandated in the 2014 Farm Bill), the Noninsured Crop Disaster Assistance Program, and other FSA programs. The 2018 Farm Bill included provisions that require FSA to analyze the Noninsured Crop Disaster Assistance Program as it relates to urban, small, and direct marketing farmers. This survey will provide data that will be useful to that endeavor.
Risk Management Agency (RMA): Data will inform implementation of the Whole Farm Revenue Protection program, which was mandated in the 2014 Farm Bill and targeted to smaller-scale, diversified producers such as those in local markets. Additionally, the 2018 Farm Bill directed RMA to carry out a study to determine the feasibility of a policy to ensure production of farm products targeted toward local consumer markets. This study will provide additional information to complement that study.
Rural Development (RD): Data will increase understanding of the value-added business activities of this sector, informing execution of some of RD’s business programs, including its Value-Added Producer Grants which were joined with AMS local food grants under the Local Agriculture Markets Program (LAMP) in the 2018 Farm Bill.
Agricultural Marketing Service (AMS): Data will increase understanding of the marketing outlets utilized by local foods farms and will shed light on the size and scope of marketing activities that take place within the local foods sector. Data will also inform the implementation of AMS grants, including the LAMP grants: Farmers Market Promotion Program, Local Food Promotion Program, and the new Regional Food Systems Partnership grants which were first authorized in the 2018 Farm Bill)
Food and Nutrition Service (FNS): Data will measure acceptance of electronic benefit transactions (EBTs) from the Supplemental Nutrition Assistance Program (SNAP) by local food farmers and farmer engagement in farm-to-school activities. The National School Lunch Act as amended relies in part on locally grown foods that are marketed directly to local schools.
In addition, statistics from this survey will be used by state agencies to better understand, support, and promote their local food markets, as well as by researchers studying local foods. The statistics will also be informative for farmers and others in the agricultural industry in planning business strategies.
Past research publications based on usage of this data include:
Bauman, A., Jablonski, B. B., Yeh, D. A., Chenarides, L., & Thilmany McFadden, D. (2024). Federal economic data on local and regional food producers. Journal of the Agricultural and Applied Economics Association, 3(3), 537-555.
Martinez, S., & Park, T. (2021). Marketing practices and financial performance of local food producers: A comparison of beginning and experienced farmers. EIB-225, U.S. Department of Agriculture, Economic Research Service.
O'Hara, J. K., & Lin, J. (2020). Population density and local food market channels. Applied Economic Perspectives and Policy, 42(3), 477-496.
O’Hara, J. K., & Low, S. A. (2020). Online sales: A direct marketing opportunity for rural farms?. Journal of Agricultural and Applied Economics, 52(2), 222-239.
Park, T., Martinez, S., & Ibrahim, M. (2024). Sales Performance of Local Food Marketers: Evaluation of Multivalued Treatment Effects. Journal of Agricultural and Resource Economics, 49(3), 549-529.
Plakias, Z. T., Demko, I., & Katchova, A. L. (2020). Direct marketing channel choices among US farmers: Evidence from the Local Food Marketing Practices Survey. Renewable Agriculture and Food Systems, 35(5), 475-489.
3. Describe whether, and to what extent, the collection of information involves the use of automated, electronic, mechanical, or other technological collection techniques or other forms of information technology, e.g., permitting electronic submission of responses, and the basis for the decision for adopting this means of collection. Also describe any consideration of using information technology to reduce burden.
For this survey, NASS plans to develop a Computer Assisted Web Interview (CAWI) version of the questionnaire along with a Computer Assisted Telephone Interview (CATI) tool.
First, a pressure sealer mailing (along with instructions on how to access the internet version) will be mailed to the sample, followed by paper questionnaires (along with instructions on how to access the internet version) will be mailed to non-respondents, with a similar follow up mailing to occur approximately 6 weeks after the initial mailing to any non-respondents. Finally, any remaining non-respondents will be contacted by telephone and/or face-to-face interviews, as budget allows. This will give respondents the flexibility to respond by several different modes.
In 2020, the response rate using Internet was 17 percent.
4. Describe efforts to identify duplication. Show specifically why any similar information already available cannot be used or modified for use for the purposes described in Item 2 above.
NASS works closely with state agriculture departments and universities to conduct agricultural surveys. These surveys meet both state and federal needs, thus eliminating duplication and minimizing reporting burden on the agriculture industry. Comprehensive data on local food producers and markets at the state and national levels are not available from any other source.
5. If the collection of information impacts small businesses or other small entities (Item 5 of OMB Form 83-I), describe any methods used to minimize burden.
The information requested can be provided with a minimum of difficulty from normal operating records. Approximately 95 percent of the operations in the sample are small businesses (as defined in the Small Business Administration’s Table of Small Business Size Standards:
6. Describe the consequence to Federal program or policy activities if the collection is not conducted or is conducted less frequently, as well as any technical or legal obstacles to reducing burden.
The Local Food Marketing Practices Survey was first conducted in 2016, referencing the calendar year of 2015, which fulfilled the requirements outlined in Section 10016(b) (2) of the 2014 Farm Bill, as mentioned in Part 1 above. The 2018 Farm Bill has provided funding to continue promoting the local food markets around the country. Data collected in 2026 referencing 2025 will be compared to the previous data obtained in 2016 and 2021 to better support future policy decisions. Without this information it would be extremely difficult to measure the changes within the local food programs, and the impact that it has had on US farmers and consumers.
For example, the final Produce Safety Rule of the Food Safety Modernization Act (P.L. 111-353) imposes new costs and regulatory burdens on produce growers, including those selling into local and regional markets. Section 10016(a)(1)(B) of the 2014 Farm Bill directed the USDA to collect data on “direct and indirect regulatory compliance costs affecting the production and marketing of locally or regionally produced agricultural food products.” The Local Food Marketing Practices Survey asks respondents about food safety related expenses, food safety certification or audits, and food safety plans. Results from this survey will be USDA’s only nationwide source of data on how the Produce Safety Rule specifically affects local foods producers.
The 2018 Farm Bill extends the importance of programs like the Farmers Markets and Local Food Promotion Program and provided permanent funding for the Food Insecurity Nutrition Incentive (FINI) program that provides monetary incentives for Supplemental Nutrition Assistance Program (SNAP) consumers to use SNAP benefits at direct-to-consumer markets and retail stores that promote locally and regionally produced foods.
7. Explain any special circumstances that would cause an information collection to be conducted in a manner inconsistent with the general information guidelines in 5 CFR 1320.5.
Race/Ethnicity Exemption Request
OMB's Statistical Policy Directive 15 (SPD-15 dated March 29, 2024) includes a revised race/ethnicity question that allows respondents to select one or more race/ethnicity categories and select one or more detailed race/ethnicity categories for each main category selected. The revised SPD-15 includes two versions of a "minimum" category question. Agencies must request and receive an exemption from OMB if they wish to use one of the "minimum" category questions.
NASS requests to use the minimum category version that includes examples for each of the seven main race/ethnicity categories on the Local Food Marketing Practices Survey. Using the minimum categories with examples would allow NASS to keep the questionnaire at 20 pages and reduce burden to the public compared to using the standard version. Disclosure and data quality concerns would prevent most summarized data from the full race/ethnicity version from publication.
Data from the 2022 Census of Agriculture (just over 1.9 million farms in 2022) show that 95.4 percent of agricultural producers are white; followed by approximately 3 percent for Hispanic, Latino, or Spanish, 1.7 percent for American Indian or Alaska Native; 1.2 percent for Black or African Americans; .70 percent for Asian; and .10 percent for Native Hawaiian or Other Pacific Islander. For more information, please see: https://www.nass.usda.gov/Publications/Highlights/2024/Census22_HL_FarmProducers_FINAL.pdf. No data are currently available on the share of the agricultural producer population that is Middle Eastern or North African.
Given that the Local Food Marketing Practices Survey only has a sample size of 65,000, it is expected that disclosure and data quality concerns would prevent the publication of many detailed race/ethnicity categories. The disclosure and data quality concerns would not justify the added respondent burden of including the detailed race/ethnicity categories.
8. Provide a copy and identify the date and page number of publication in the Federal Register of the agency's notice, required by 5 CFR 1320.8 (d), soliciting comments on the information collection prior to submission to OMB. Summarize public comments received in response to that notice and describe actions taken by the agency in response to these comments.
The Federal Register Notice soliciting comments was published on January 30, 2025, on pages 8513–8514. NASS received a total of seven public comments. Three of these comments supported the survey, while the remaining four were deemed non-substantial. The comments are attached to this submission.
Describe efforts to consult with persons outside the agency to obtain their views on the availability of data, frequency of collection, the clarity of instructions and record-keeping, disclosure, or reporting format (if any), and Provide on the data elements to be recorded, disclosed, or reported.
NASS continues to work closely with data users and other government agencies to clarify which data would be most useful and how best to collect data.
9. Explain any decision to provide any payment or gift to respondents.
There are no payments or gifts to respondents.
10. Describe any assurance of confidentiality provided to respondents and the basis for the assurance in statute, regulation, or agency policy.
Questionnaires include a statement that individual reports are confidential. U.S. Code Title 18, Section 1905; U.S. Code Title 7, Section 2276; and the Confidential Information Protection and Statistical Efficiency Act of 2018, Title III of Pub. L. No. 115-435, codified in 44 U.S.C. Ch. 35 and other applicable Federal laws. All employees of NASS and all enumerators hired and supervised under a cooperative agreement with the National Association of State Departments of Agriculture (NASDA) must read the regulations and sign a statement of compliance.
The following CIPSEA Pledge statement will appear on all future NASS questionnaires.
The information you provide will be used for statistical purposes only. Your responses will be kept confidential and any person who willfully discloses ANY identifiable information about you or your operation is subject to a jail term, a fine, or both. This survey is conducted in accordance with the Confidential Information Protection and Statistical Efficiency Act of 2018, Title III of Pub. L. No. 115-435, codified in 44 U.S.C. Ch. 35 and other applicable Federal laws. For more information on how we protect your information please visit: https://www.nass.usda.gov/confidentiality.
11. Provide additional justification for any questions of a sensitive nature.
There are no questions of a sensitive nature.
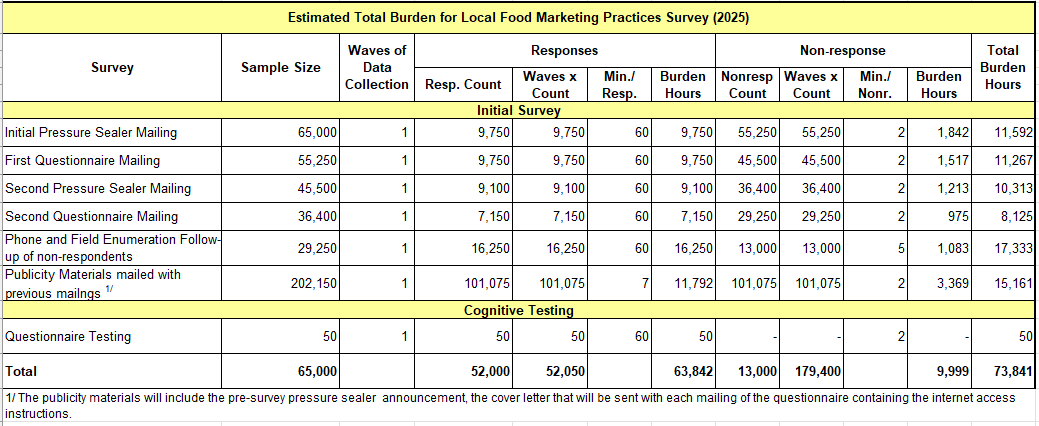
12. Provide estimates of the hour burden of the collection of information. The statement should indicate the number of respondents, frequency of response, annual hour burden, and an explanation of how the burden was estimated. If this request for approval covers more than one form, provide separate hour burden estimates for each form and aggregate the hour burdens in Item 13 of OMB Form 83-I. Provide estimates of annualized cost to respondents for the hour burdens for collections of information, identifying and using appropriate wage rate categories.
The renewal includes 65,000 samples generating 231,450 responses and totaling 73,841 burden hours.
Average minutes per response for the surveys included in this docket are based on the amount of data asked on the questionnaire and the time needed for respondents to find and report the data. Total hours of burden are shown in the table below.
Cost to the public of completing a questionnaire is assumed to be comparable to the hourly rate of those requesting the data. Reporting time of 73,841 hours is multiplied by $45.32 per hour for a total cost to the public of $3,346,474.12
NASS uses the Bureau of Labor Statistics’ Occupational Employment Statistics (most recently published on April 2, 2025 for the previous May) to estimate an hourly wage for the burden cost. The May 2024 mean wage for bookkeepers was $25.01. The mean wage for farm managers was $46.75. The mean wage for farm supervisors was $30.46. The mean wage of the three is $34.07. To calculate the fully loaded wage rate (includes allowances for Social Security, insurance, etc.) NASS will add 33% for a total of $45.32 per hour.
13. Provide an estimate of the total annual cost burden to respondents or record-keepers resulting from the collection of information.
There are no capital/start-up or ongoing operation/maintenance costs associated with this information collection.
14. Provide estimates of annualized cost to the Federal government; provide a description of the method used to estimate cost which should include quantification of hours, operational expenses, and any other expense that would not have been incurred without this collection of information.
The total cost to the Federal Government for the Local Food Marketing Practices Survey is estimated to be $3.8 million. Almost all the total goes to federal personnel wages and benefits; the remainder is for data collection, supplies, postage, computer processing, and similar items.
15. Explain the reasons for any program changes or adjustments reported in Items 13 or 14 of the OMB Form 83-I (reasons for changes in burden).
This is a reinstatement of a data collection package last conducted in 2021 referencing calendar year 2020. The reinstatement will be for a survey conducted in 2026 referencing calendar year 2025. There will be no program changes to the sampling population compared to the final 2020 sample. There was a substantive change to the 2020 survey which was conducted in phases. The first phase included agricultural operations with known local foods activity. The second phase included only agricultural operations with an unknown presence of local foods activity. Agricultural operations with known and unknown presence of local foods activity will be included in the 2025 survey which will only have one phase.
16. For collections of information whose results will be published, outline plans for tabulation and publication. Address any complex analytical techniques that will be used. Provide the time schedule for the entire project, including beginning and ending dates of the collection of information, completion of report, publication dates, and other actions.
All the data will be available in NASS Quick Stats found at: https://quickstats.nass.usda.gov/.
The table below contains the projected schedule for this survey:
Task |
Target Date |
Initial Pressure Sealer Mailing |
11/21/2025 |
Initial Questionnaire Mailing |
1/6/2026 |
Second Pressure Sealer Mailing |
1/23/2026 |
Follow-up Questionnaire Mailing |
2/27/2026 |
Phone Enumeration Follow-up |
April 2026 |
Field Enumeration Follow-up |
April 2026 |
Data Analysis |
April to October 2026 |
Quick Stats/Disclosure Review |
November 2026 |
Quick Stats Release (Proposed) |
12/15/2026 |
17. If seeking approval to not display the expiration date for OMB approval of the information collection, explain the reasons that display would be inappropriate.
There is no request for approval of non-display of the expiration date.
18. Explain each exception to the certification statement identified in Item 19, “Certification for Paperwork Reduction Act Submissions” of OMB Form 83-I.
There are no exceptions to the certification statement.
May 2025
| File Type | application/vnd.openxmlformats-officedocument.wordprocessingml.document |
| Author | HancDa |
| File Modified | 0000-00-00 |
| File Created | 2025-06-19 |
© 2026 OMB.report | Privacy Policy