NRS Part B 2025
NRS Part B 2025.docx
National Roadside Survey of Alcohol and Drug Prevalence of Road Users: 2025
OMB:
National Roadside Survey of Alcohol and Drug Prevalence of Road Users: 2025
Supporting Statement Part B
Information Collection Request Supporting Statement: Part B
National Roadside Survey of Alcohol and Drug Prevalence of Road Users: 2025
OMB Control Number: 2127- new
Abstract:1 National Roadside Surveys (NRSs) are a central tool in understanding alcohol- and drug-involved driving. Starting in 1973,2 roadside surveys of drivers on the road have estimated the population-level prevalence of drinking and driving in the United States. The core methodology has continued across decades, but NHTSA has initiated improvements. The number of sites has increased, drugs of interest have been modified to reflect use across the country, and advances in technology have impacted how data can be collected and specimens analyzed.
Conducting an NRS on a periodic basis (e.g., about every 10 years) allows NHTSA to examine the prevalence of alcohol and drug use among drivers, and trends across survey years. Given States are legalizing medicinal and/or recreational use of cannabis, and other issues such as the apparent increase in opioid use in the U.S., more information is needed on the level of alcohol- and drug-involved driving to better inform NHTSA’s countermeasure development.
Roadside surveys provide objective measures of alcohol and drugs in drivers’ systems when they are actually driving. These measures are based on results from breath tests and oral fluid samples collected using established protocols. Analyses of these specimens allow for the quantitative determination of alcohol and drug levels. Learning more about alcohol and other drug prevalence among road users other than drivers is new to this NRS. These other road users (ORUs) include pedestrians, bicyclists, scooterists, and those using mobility aids.
NHTSA will conduct two studies. Study 1 will focus on drivers but include convenience sampling of ORUs passing by the data collection locations. Study 2 is a pilot test assessing the feasibility of an NRS specific to ORUs. Both will collect breath and oral fluid specimens, demographic information, and self-report questionnaire data on roads across the country. Participation will be voluntary and anonymous. Study protocols will be reviewed by a U.S. Department of Health and Human Services-approved Institutional Review Board (IRB). The only personal identifiable information (PII) collected is oral fluid. No DNA analyses will be conducted on the oral fluid specimens. These will only be analyzed for the presence of alcohol and other drugs, and specimens will be destroyed after the study is complete. The results will be reported in aggregate form in research reports. NHTSA anticipates obtaining a Certificate of Confidentiality from the National Institutes of Health (NIH).
Study 1 / National Roadside Survey. This request is a voluntary, one-time survey. This survey follows the prior NRS methodology but additionally includes recruiting ORUs who are passing data collection locations. Data collection will occur in 60 primary sampling units (PSUs) using 5 locations at each PSU (300 locations total). There will be a single data collection event at each location. The biological samples will be sent to a toxicology lab for testing of the presence of alcohol and other drugs. Participants’ responses to survey questions on the use of drugs and traffic safety-related behaviors and attitudes will also be analyzed.
Study 2 / Pilot Test for Other Road Users. Study 2 examines the viability of a stand-alone roadside survey focused solely on ORUs. This effort uses 20 new data collection locations, inclusive of 4 PSUs with 5 locations each. This effort is to inform NHTSA on the feasibility of such a targeted roadside survey and to determine the level of effort to execute a nationwide study of ORUs. The same procedures as Study 1 will be used.
NHTSA will use the information from both studies to produce technical reports presenting the findings. The technical reports will provide only aggregate (summary) statistics and tables; no PII will be retained or reported. The Study 1 technical report is for audiences interested in traffic safety. The information from Study 2 will also be used by NHTSA in consideration of research on ORUs.
B.1. Describe (including a numerical estimate) the potential respondent universe and any sampling or other respondent selection methods to be used. Data on the number of entities (e.g., establishments, State and local government units, households, or persons) in the universe covered by the collection and in the corresponding sample are to be provided in tabular form for the universe as a whole and for each of the strata in the proposed sample. Indicate expected response rates for the collection as a whole. If the collection had been conducted previously, include the actual response rate achieved during the last collection. Response rate means -- of those in your respondent sample, from what percentage do you expect to get the required information (if this is not a mandatory collection). The non-respondents would include those you could not contact, as well as those you contacted but who refused to give the information.
Study 1: National Roadside Survey (Drivers and ORUs)
Driver Sampling
The Study 1 potential respondent universe will be composed of all drivers of passenger vehicles on trips on trafficways in the lower 48 States and District of Columbia on the days of the week and times of day as follows:
Friday daytime – 9:30 a.m. to 11:30 a.m. or 1:30 p.m. to 3:30 p.m.
Friday nighttime – 10 p.m. to 12 a.m.
Saturday early morning – 1 a.m. to 3 a.m.
Saturday nighttime – 10 p.m. to 12 a.m.
Sunday early morning – 1 a.m. to 3 a.m.
These are the same days of week and times of day used in the 2007 and 2013-2014 NRSs. Eligible participants for Study 1 will include those 18 years of age (16 years of age in States where allowed) or older who are operating a personal vehicle on the selected roadways for data collection. Additionally, Study 1 will gather information from ORUs who are traveling around the selected NRS roadways.
Logistical considerations for studies such as the NRS require multiple stages of sample selection to ensure that all drivers on trips for the selected days and times have representation in the sample. It is not feasible, however, to make a list of all driver trips and sample from it. Further, it would not be feasible to intercept those drivers on trips because it would require prohibitive staffing levels or travel requirements. Instead, the sample is selected in multiple stages, with the first stage consisting of primary sampling units (PSUs) of contiguous and relatively large geographic areas. Proper selection of PSUs is critical to the representativeness of the study and ensures representativeness of the driver selection strategy used at each location. Study 1 will follow procedures similar to those used in past NRSs that were designed to reflect the totality of the traffic/roadway experience in the country. PSUs will be selected to include all basic geographic regions and various levels of population densities. This will help avoid a bias from selecting drivers from limited geographic and demographic strata. Within PSUs, additional stages of selection will continue until drivers are selected at the final stage and recruited into the data collection location. Each of the sampling stages for Study 1 are described below.
Stage 1
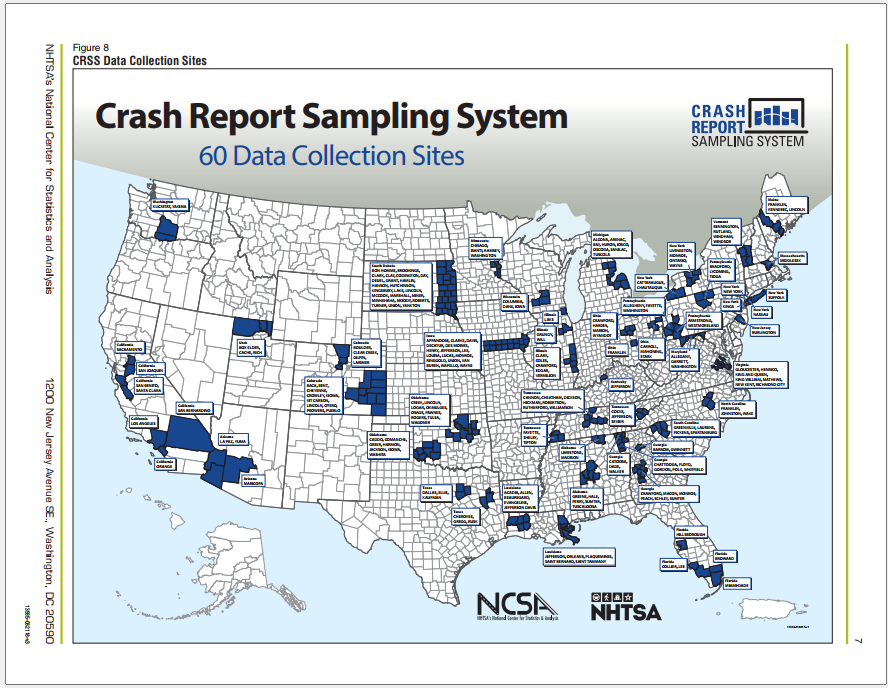
A list of all possible PSUs in the contiguous United States is the first-stage sampling frame. It is divided into exhaustive, non-overlapping strata. Independent samples of PSUs are drawn from each of the strata. The stratification ensures representation of different types of PSUs with geographic dispersion and different population densities. For past NRSs, NHTSA had the National Automotive Sampling System General Estimates System (NASS GES) as the foundation for PSU selection. This system was designed to identify a nationally representative sample from which crash reports/data could be obtained to aid in the calculation of national crash estimates. Prior NRSs used this selection approach because it was deemed to be representative of driving exposure in the country. The last NRS used 60 PSUs based on the same PSU selection methods used by the NASS GES as the foundation for site selection. The NASS GES PSUs were composed of cities, large counties, or groups of counties from within four regions of the country and three levels of population density.
Since the last NRS was completed, NHTSA undertook a data modernization effort and replaced NASS GES with the Crash Report Sampling System (CRSS). Zhang et al. (2019)3 and
Zhang et al. (2018)4 provide detailed descriptions of CRSS and the sampling approach. The most germane points from the two reports are summarized here. The target population for the CRSS is the same as that for the GES: all police-reported motor vehicle crashes on trafficways. At the first stage of selection, 3,117 counties in the United States were grouped into 707 PSUs. A PSU in the CRSS is either a county or a group of counties. U.S. territories, some remote counties in Alaska, and small islands of Hawaii were excluded. The 707 PSUs in the PSU frame (the collection of all PSUs) were stratified into 50 strata by the four Census regions, urban/rural, vehicle miles traveled, total number of crashes, total truck miles traveled, and road miles. Each of the 707 PSUs in the frame was assigned a measure of size (MOS) equal to the combination of its estimated nine types of crash counts. First, 101 PSUs were selected by a stratified probability proportional-to-size (PPS) sampling method. Then a sequence of sub-samples was selected from the 101 PSU samples, and in this process the strata were collapsed if necessary. This produced a sequence of nested PSU samples with decreasing sample sizes selected from the collapsed strata. These nested PSU samples allow NHTSA to change the PSU sample size without reselecting the sample in the future. Therefore, the final PSU sample was the result of a multiphase sampling, and the PSU sample was selected in such a way that the resulting selection probability was still approximately PPS. The final probability sample of 60 CRSS PSUs is shown on the map in Figure 1.5 Table 1 lists the counties that compose each CRSS PSU, ranging from a single county up to 23 counties.
State |
Counties in PSU |
State |
Counties in PSU |
AL |
Limestone, Madison |
MI |
Alcona, Arenac, Bay, Huron, Iosco, Oscoda, Sanilac, Tuscola |
AL |
Greene, Hale, Perry, Sumter, Tuscaloosa |
MN |
Chisago, Isanti, Ramsey, Washington |
AZ |
Maricopa |
NC |
Franklin, Johnston, Wake |
AZ |
La Paz, Yuma |
NJ |
Burlington |
CA |
Orange |
NY |
Nassau |
CA |
Los Angeles |
NY |
Kings |
CA |
San Bernardino |
NY |
New York |
CA |
Santa Clara, San Benito |
NY |
Suffolk |
CA |
San Joaquin |
NY |
Livingston, Monroe, Ontario, Wayne |
CA |
Sacramento |
NY |
Cattaraugus, Chautauqua |
CO |
Boulder, Clear Creek, Gilpin, Larimer |
OH |
Franklin |
CO |
Baca, Bent, Cheyenne, Crowley, Kiowa, Kit Carson, Lincoln, Otero, Prowers, Pueblo |
OH |
Carroll, Mahoning, Stark |
FL |
Miami-Dade |
OH |
Crawford, Hardin, Marion, Wyandot |
FL |
Broward |
OK |
Caddo, Comanche, Greer, Harmon, Jackson, Kiowa, Washita |
FL |
Collier, Lee |
OK |
Creek, Lincoln, Logan, Okmulgee, Osage, Pawnee, Rogers, Tulsa, Wagoner |
FL |
Hillsborough |
OR |
Clackamas, Marion, Polk, Yamhill |
GA |
Catoosa, Dade, Walker |
PA |
Allegheny, Fayette, Washington |
GA |
Chattooga, Floyd, Gordon, Polk, Whitfield |
PA |
Bradford, Lycoming, Tioga |
GA |
Barrow, Gwinnett |
PA |
Armstrong, Westmoreland |
GA |
Crawford, Macon, Monroe, Peach, Schley, Sumter |
SC |
Greenville, Laurens, Pickens, Spartanburg |
IA |
Appanoose, Clarke, Davis, Decatur, Des Moines, Henry, Jefferson, Lee, Louisa, Lucas, Monroe, Ringgold, Union, Van Buren, Wapello, Wayne |
SD |
Bon Homme, Brookings, Clark, Clay, Codington, Day, Deuel, Grant, Hamlin, Hanson, Hutchinson, Kingsbury, Lake, Lincoln, McCook, Marshall, Miner, Minnehaha, Moody, Roberts, Turner, Union, Yankton |
IL |
Lake |
TN |
Cocke, Jefferson, Sevier |
IL |
Grundy, Will |
TN |
Cannon, Cheatham, Dickson, Hickman, Robertson, Rutherford, Williamson |
IL |
Clark, Coles, Crawford. Edgar, Vermillion |
TX |
Dallas, Ellis, Kaufman |
KY |
Jefferson |
TX |
Cherokee, Gregg, Rusk |
LA |
Acadia, Allen, Beauregard, Evangeline, Jefferson Davis |
UT |
Box Elder, Cache, Rich |
LA |
Jefferson, Orleans, Plaquemines, St. Bernard, St. Tammany |
VA |
Gloucester, Henrico, King & Queen, King William, New Kent, Richmond City |
MA |
Middlesex |
VT |
Bennington, Rutland, Windham, Windsor |
MD |
Allegany, Garrett, Washington |
WA |
Klickitat, Yakima |
ME |
Franklin, Kennebec, Lincoln |
WI |
Columbia, Dane, Iowa |
Study 1 will begin with a base sample consisting of the 60 CRSS PSUs. If there are any issues with participation among the original 60 CRSS PSUs, the study will expand the sample to include PSUs from the larger set of PSUs (707 in total). The expanded sample would reflect the known stratification and size measures of the larger PSU set and, like the original 60 CRSS PSU sample, would not be a simple random sample. Selecting the expanded sample of PSUs alters the overall selection probabilities because PSUs had more than one opportunity to enter the combined sample. The study statisticians will use standard techniques for dual frame samples to compute the correct selection probabilities.
If a CRSS PSU contains only one county, that county will serve as the Study 1 PSU. If the CRSS PSU contains more than one county, the study will randomly select one or more counties to represent the entire PSU to reduce travel burden. A random number generator will be used to assign each county a value between 1 and X (X = the highest sequential number used for the counties). The county assigned a value of 1 will be selected for the study. If that county cannot participate, the county assigned the value of 2 will be selected and so forth until a viable county is identified. Study staff will coordinate with the NHTSA Contracting Officer’s Representative (COR) throughout this process. The study team will contact officials at the State level, and project staff will make contacts at the local level for each selected county to explain the study and invite participation. If the first county’s representatives decline to participate, the second county will be selected, and so on. Characteristics of counties unwilling to participate will be noted for possible nonresponse weighting adjustments. Analysts can make weighting adjustments to account for differential participation. For example, if urban counties are more likely to decline participation than rural counties, the participating urban counties would be underrepresented in NRS data and would need to be upweighted, while rural counties would be overrepresented and would need to be down weighted.
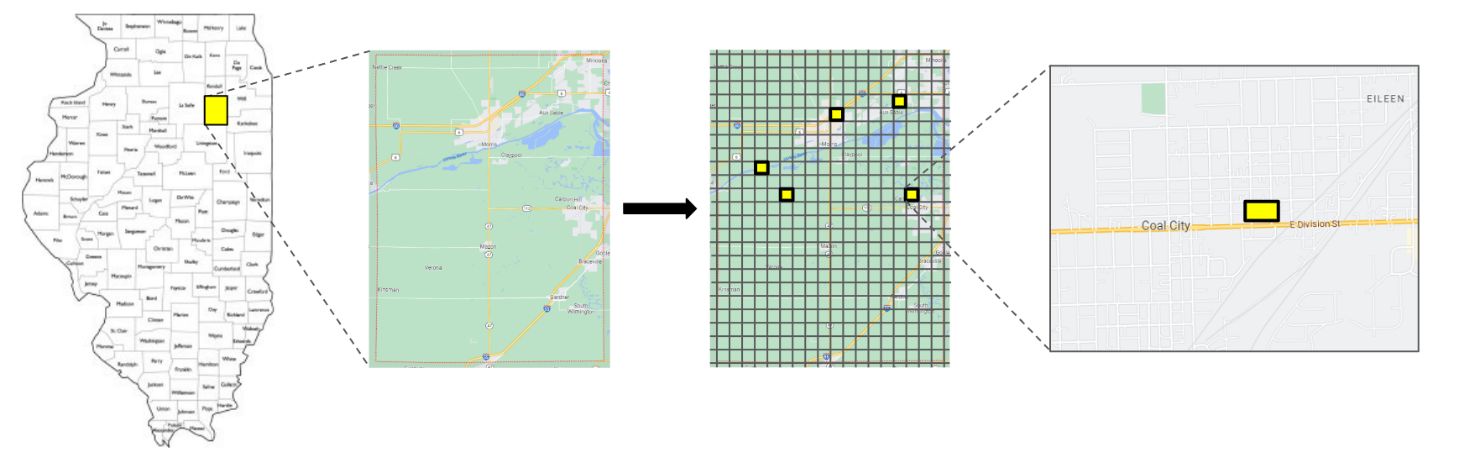
The Stage 2 selection process for data collection locations within counties will begin once cooperation has been established at the State and local levels. Once cooperation is obtained from the local representatives, the study team will begin dissecting the county into one-mile square grids from which a random sample of squares will be identified (Figure 2). Squares with expansive uninhabited areas (e.g., lakes, forests) will be removed from the list before random selection begins. The remaining one-mile squares will be assigned a sequential number starting in the left uppermost corner of the county and then proceeding down until the square in the bottom rightmost corner has been assigned a number. A random number generator will then be used to assign a value between 1 and X (X = the highest sequential number used for the grids) to each square. The list of squares will then be sorted by the randomly generated number values. The locations assigned randomly generated numbers 1-5 will then be explored for viable roadside locations using the Stage 3 process described below. Another 25 randomly selected squares will be identified in each PSU in case more locations must be contacted due to property owners or local officials declining to participate.
Stage 3
The next step will involve identifying one roadway segment using Google Maps® in each selected square that will be the roadway from which drivers are recruited. The study team must then work with local officials to identify a suitable location for safe collection of data at the roadside. There must be off-road parking with space for survey bays. The intent is to provide the research team and all potential participants with a safe space to interact. The location needs to provide sufficient viewing distance to allow drivers to see a researcher at the roadside and safely slow down to enter the data collection area. If needed, the study team will check with the property owner to acquire permission to use the location. Alternate locations in each selected square will be identified to the extent they are available in case there are issues operating at a given location. This roadway review procedure will be repeated for all the potential locations to ensure their suitability. If staff are unable to identify a suitable data collection location within a square, the next square in the list will be investigated until five locations have been identified in each PSU/site with further backups identified in case data collection is ultimately not possible at a selected location for some reason. Characteristics of selected locations that participate and that do not participate will be compared for possible use in nonresponse adjustment such as that described in Stage 1. Traffic flow at the locations will be examined and to the extent possible, times for data collection will be randomly assigned to data collection locations. Locations with the least amount of traffic may not be appropriate for the early morning data collection periods.
The PSU and data collection location selection approach described in Stages 1 and 2 results in clusters of drivers passing by the data collection locations during the specified days and time windows of the study. Teams of data collectors will recruit drivers from driver clusters. For a study of this type, obtaining as many driver intercepts as possible at each data collection location while avoiding any systematic bias in selection is most important. The number of intercepts that are possible at a location is largely dependent on the size of the data collection team, the time it takes for a participant to complete the study, and the flow rate of passing drivers. At very low flow locations, a data collection team of the size planned for this study will likely be able to collect data from a large proportion of the drivers on the roadway at that location. At a high flow location, the data collection bays will fill quickly at the start of data collection and the traffic director will stop actively recruiting drivers until a bay opens. Once a bay opens, the traffic director will begin recruiting again until the bays are full. The goal is to provide all passing drivers an equal opportunity to participate when a data collector is available to process a participant. The study teams will be trained to avoid any bias in recruiting drivers except that the study will make a special effort to recruit all motorcycle riders as this is a sub-group of special interest to NHTSA because they are relatively rare compared to other vehicle operator types.
Overall, the strength of this sampling design comes from the Stage 1 and 2 PSU/site and data collection location selection procedures. Stages 3 and 4 are reliant on voluntary participation of drivers. Because of both logistical constraints on the data collection team for processing participants and the voluntary nature of participation, the recruited drivers could be subject to biases that need to be accounted for analytically. The study will gather as much information as possible (e.g., age, sex, race, vehicle type) on those who pull into the data collection location but subsequently decline to participate. The study also plans to count all vehicles passing by each data location. This will allow the study to make appropriate weighting adjustments such as those described for Stages 1 and 2. With appropriate adjustments, the recruited drivers can represent their clusters, selected data collection locations can represent participating counties, and participating counties can represent the nation. Specifically, the sampling design at Stage 1 and Stage 2 allows for a representative sample of drivers on trips to be selected given the known methodological challenges of recruiting an unbiased sample of drivers during data collection at each location.
In addition to drivers, Study 1 is exploring the feasibility of recruiting a sample of ORUs for participation at the data collection locations being used for drivers. ORU-related factors will not have been the focus of the Stage 1 and Stage 2 location selection process. When a location looks as if it can support recruitment of ORUs, a recruitment process similar to that used for the drivers will be employed. Some locations will likely have no, or very few ORUs available, especially in the early morning data collection times. It is anticipated that only a single data collector will be assigned to ORU data collection at each location. All ORUs at low flow locations will be approached to participate when possible. At high ORU flow locations, the assigned data collector will only be able to actively recruit an ORU after they finish collecting data from the current participant being surveyed. This effort is not designed to provide a statistically valid estimate of drug prevalence among the ORU population at any level, and interpretation of results will not be generalized to the larger population of ORUs in any way.
Study 1: Summary of NRS Sampling Features and Expected Participation Rate
Table 2 provides a summary of the sampling features of Study 1. As noted above, this study’s primary target population is drivers of personal vehicles on trips during the selected days of week and times of day. The highest level of the sampling frame uses NHTSA’s CRSS PSUs and associated stratification factors shown in the table. The second stage involves random selection of 1-mile square areas within each PSU. Study staff then must use mapping software and work with local officials to identify an appropriate roadside site for data collection within each grid. Finally, all drivers passing by the data collection location will be afforded equal opportunity to volunteer to participate when a data collector is available to process participants. At a specific data collection location, no special efforts will be made to recruit drivers in any particular strata except that motorcycle riders will be given priority for statistical power because of their relatively infrequent nature compared to other vehicle operator types. ORUs will be included when they are readily available at a data collection location as part of a feasibility effort. All participants will be recruited from live traffic. Each will be asked to complete a breath test for alcohol, provide an oral fluid specimen for other drug testing, and complete surveys on a study tablet as described in the procedures section that follows.
Feature |
Study 1 National Sample |
Target Populations |
Primary Target Population = U.S. licensed adults aged 18 (16 in States that allow participation without parental consent) or older who are driving on public roadways Secondary Target Population = U.S. adults aged 18 (16 in some States) and older who are traveling on public roadways by a means other than driving (e.g., pedestrian, bicyclist, scooterist) |
Sampling Design |
|
CRSS PSU Stratification |
Census region, urban/rural, vehicle miles traveled, total number of crashes, total truck miles traveled, and road miles |
Recruitment |
Intercept on live roadway |
Survey Administration |
Breath test, oral fluid test, Internet-connected tablet |
An exact count of the full respondent universe is not known at this time given the complexities associated with counting drivers on trips during specific days and times across a large number of roadways. The 2013-2014 NRS serves as the best estimate of the number of driver encounters that can be expected for Study 1 to gather the desired sample size. Study 1 expects to contact approximately 11,750 drivers with 9,000 agreeing to participate. Based on the last NRS results, it is expected 8,000 drivers will fully participate and 1,000 will partially participate (i.e., stops providing information before full data collection is complete). Study 1 also expects to contact 750 ORUs at the data collection locations with 500 fully participating and 60 partially participating. Table 3 provides the demographic distributions obtained in the 2013-2014 NRS and the estimated number of participants in each category Study 1expects given the sample size goal of 8,000 drivers and 500 ORUs fully completing participation. These values are estimates according to the planned sampling techniques. Actual counts could vary in the final sample.
Variable |
Category |
Distribution |
Estimated Completes |
Study 1 Drivers |
|
|
N = 8,000 |
Age |
16–20 |
12.36% |
989 |
|
21–34 |
40.69% |
3255 |
|
35–44 |
16.63% |
1330 |
|
45–64 |
24.68% |
1975 |
|
65+ |
5.64% |
451 |
Race/Ethnicity |
African American |
20.23% |
1619 |
|
Asian |
4.14% |
331 |
|
Hispanic |
10.85% |
868 |
|
White |
58.76% |
4701 |
|
Other |
6.03% |
482 |
Sex |
Male |
58.01% |
4641 |
|
Female |
41.99% |
3359 |
Study 1 ORUs* |
|
|
N = 500 |
Age |
16–20 |
12.36% |
62 |
|
21–34 |
40.69% |
203 |
|
35–44 |
16.63% |
83 |
|
45–64 |
24.68% |
123 |
|
65+ |
5.64% |
28 |
Race/Ethnicity |
African American |
20.23% |
101 |
|
Asian |
4.14% |
21 |
|
Hispanic |
10.85% |
54 |
|
White |
58.76% |
294 |
|
Other |
6.03% |
30 |
|
|
|
|
Sex |
Male |
58.01% |
290 |
|
Female |
41.99% |
210 |
*ORU distributions mirror those of drivers, as no prior studies are available to provide a stronger estimate.
Study 1: NRS Sample Size and Statistical Power
For a one-time measurement of alcohol and other drug prevalence, the equation below can be used to calculate the sample size needed for a given prevalence rate at a specific level of statistical confidence and precision.
n = Z2P(1 – P)
d2
Z = Z statistic for a level of confidence (e.g., Z = 1.96 for 95% confidence)
P = expected prevalence (e.g., 13% or 0.13 estimated from prior studies)
d = precision (e.g., 3% or 0.03 which provides a margin of error of +3%)
To have 95% confidence in a prevalence study with an expected individual drug prevalence rate of about 13% and +3% precision, a study only requires 483 participants as seen below.
n = (1.96)2 (.13)(1 - .13) = 482.76 or about 483 participants
(.03)2
If greater precision is desired in this example (e.g., +1%) with roughly 13% prevalence observed, 4,345 participants would be needed.
n = (1.96)2 (.13)(1 - .13) = 4,344.85 or about 4,345 participants
(.01)2
Table 1 provides the sample size requirements for a one-time prevalence study at other rates of drug prevalence and precision requirements. The proposed sample size of 8,000 would allow for reliable overall estimates of drugs at low prevalence rates as well as very precise estimates (i.e., +1%) for higher prevalence drugs. Having 8,000 participants allows the sample to be divided by a variety of factors (e.g., age, sex, time of day) and still have enough participants in each group to provide relatively precise estimates of alcohol and other drug prevalence for each group.
Sample Size Required to Detect Prevalence at One Time Point
|
Precision + |
|||
Prevalence |
.01 |
.02 |
.03 |
.05 |
3% (.03) |
1,118 |
NA |
NA |
NA |
5% (.05) |
1,825 |
457 |
203 |
NA |
10% (.10) |
3,458 |
865 |
385 |
139 |
15% (.15) |
4,899 |
1,225 |
545 |
196 |
20% (.20) |
6,146 |
1,537 |
683 |
246 |
25% (.25) |
7,203 |
1,801 |
801 |
289 |
Z = 1.96.
Study 1: Statistical Analysis Plan
The analyses will focus on drug prevalence (presence/absence). Prevalence of alcohol and other drugs will be estimated for the total sample and broken out by a variety of variables and combinations of variables of interest to NHTSA, including but not limited to:
Individual drugs and metabolites
Drug class
Age group
Sex
Race/Ethnicity
Vehicle Type
Daytime/Nighttime
Given Study 1 follows a complex sampling design, with stratification, multiple stages of selection (from PSUs to locations within PSUs to road users), and unequal probabilities of selection at different stages, estimation of prevalence will use best statistical practices for the weighted analysis of complex survey data. The complexities of the design must be reflected in the analysis to yield representative national estimates and appropriate measures of uncertainty. Failing to weight survey data often results in biased estimates of population characteristics, because certain areas have been sampled at higher rates and are thus overrepresented in the sample data relative to their presence in the population, while other areas are sampled at lower rates and are underrepresented in the sample data. Thus, the prevalence estimates will be weighted survey ratios, with the weighted sum of alcohol- and/or drug-positive drivers on trips in the numerator and the weighted sum of all drivers on trips in the denominator. Such ratios can also be computed for subpopulations (by demographic groups, geographic areas, etc.). For example, rural prevalence would be estimated as the weighted sum of alcohol- and/or drug-positive rural drivers on trips in the numerator and the weighted sum of all rural drivers on trips in the denominator. Software for the analysis of complex survey data will be used to compute the weighted prevalence estimates and standard errors. The standard errors will properly account for the stratification, multiple stages of selection, and unequal inclusion probabilities.
Descriptive results will be provided for the various demographic and questionnaire information being collected. Minimal statistical analyses comparing groups will be performed to describe whether significant differences in drug prevalence or self-report measures exist between major subgroups of the sample (e.g., sex, age), but the primary focus of sampling remains the acquisition of a nationally representative sample of drivers to provide a stable estimate of alcohol and other drug prevalence at the national level.
Study 2: Feasibility Assessment to Determine the Viability of a Nationwide Roadside Survey Focusing on ORUs
A variety of data collection approaches will be explored to determine which yields the most appropriate data to meet NHTSA’s objectives. The objective with this Study 2 feasibility assessment is not to obtain a representative sample of ORUs in the United States, but to explore methodologies that could potentially allow for the collection of such a sample.
Study 2 anticipates selecting 20 new sampling locations (4 PSUs with 5 locations each). As this is a feasibility study, various strategies will be explored to yield a high number of potential participants. The exact data that will inform PSU selection has yet to be determined. For example, StreetLight is a data science firm that tracks and collects mobility data. They have the capability of providing pedestrian6 and bicyclist7 traffic density information separately for daytime and nighttime hours that could be used for selection of sampling locations. Another approach involves using data on ORU crashes from a source such as NHTSA’s Crash Investigation Sampling System (CISS) which contains information on whether a vehicle struck a pedestrian, bicyclist, or other non-motorist, as well as GPS coordinates (latitude and longitude). A combination of the two types of data will also be explored to see how site selection is affected.
For convenience of Study 2 data collection, it is anticipated the new PSUs will be counties in a large metropolitan area. The study currently plans to select 2 counties with large urban populations, 1 county that is mainly suburban, and 1 rural county to explore the viability of collecting data within each given the expected difference in ORU density by urbanicity.
Study 2 will consist of eligible ORUs that are 18 years of age (16 years of age in States where allowed) or older who are traveling around the selected sampling locations. Study 2 expects to contact approximately 750 individuals with 500 fully participating and 60 partially participating across the 4 PSUs. Plans will be updated throughout the project as various methods and data collection approaches are tested and the results discussed with NHTSA. Expected demographic distributions of the 500 participants are provided in Table 5.
Study 2 Estimated Completes Based on the 2013-2014 NRS Demographic Distribution
Variable |
Category |
Distribution |
Estimated Completes |
Study 2 ORUs* |
|
|
N = 500 |
Age |
16–20 |
12.36% |
62 |
|
21–34 |
40.69% |
203 |
|
35–44 |
16.63% |
83 |
|
45–64 |
24.68% |
123 |
|
65+ |
5.64% |
28 |
|
|
|
|
Race/Ethnicity |
African American |
20.23% |
101 |
|
Asian |
4.14% |
21 |
|
Hispanic |
10.85% |
54 |
|
White |
58.76% |
294 |
|
Other |
6.03% |
30 |
|
|
|
|
Sex |
Male |
58.01% |
290 |
|
Female |
41.99% |
210 |
*ORU distributions for Study 2 mirror those of drivers and ORUs in Study 1 as no prior studies are available to provide a stronger estimate.
Given the small sample size and nature of the convenience sample to be obtained, no statistical analyses other than basic summations and crosstabs will be conducted for Study 2.
B.2. Describe the procedures for the collection of information, including:
Statistical methodology for stratification and sample selection.
As described above for Study 1, each of the 707 PSUs in the frame was assigned a measure of size equal to the combination of its estimated nine types of crash counts. From this original set 101 PSUs were selected by a stratified probability proportional-to-size (PPS) sampling method. Then a sequence of sub-samples was selected from the 101 PSU samples, and in this process the strata were collapsed if necessary. This produced a sequence of nested PSU samples with decreasing sample sizes selected from the collapsed strata. Study 1 will begin with this base sample of 60 CRSS PSUs. The sampling itself for Study 1 will be conducted in the four stages described in section B.1.
Study 1: Recruitment Procedures
Study 1 Driver Recruitment Procedures
Large, diamond-shaped signs will be used at each location to recruit drivers in combination with a researcher acting as a traffic director. A sign that says “Paid Voluntary Survey Ahead” will be placed about 100 feet, or about a block, from the entrance of the sampling location. The second sign, with a dollar amount listed (e.g., “Make $20 for 10 Minutes”) will be placed about 50 feet, or about half a block, from the entrance of the sampling location. The third sign, “Stop Here to Volunteer,” will be placed at the entrance of the sampling location. Signs will be placed in a safe, visible area. They will not obstruct a driver’s view of the roadway and will not be placed on private property unless permission is granted by the property owner. The signs will be placed face down during the data collection location set-up, otherwise vehicles may begin entering the bay before the data collectors are ready to begin. Once every study team member is ready and the site is prepared for data collection, the signs will be raised so they are visible to the driving public. Changeable message signs, if available, may also be used when lighting is poor.
One of the study team members will be designated to recruit drivers from free-flowing traffic. This traffic director will use traffic wands to alert drivers in traffic on the roadway to the data collection bay area if they would like to participate. The traffic director may be able to speak to drivers if the location is near a stop sign or traffic light. When traffic flow is high, the traffic director will be instructed to modulate recruiting if all data collection bays are full. Active recruitment of drivers will stop when all bays are full, but the study signs will remain upright. When a bay opens, the traffic director will begin recruiting again. Overall, researchers will recruit as many drivers as possible during each data collection period. The driver inclusion/exclusion criteria are as follows:
Driver Inclusion
Operating a personal motor vehicle (e.g., car, pick-up truck, van, SUV, motorcycle) on the selected roadway
At least 18 years old (some States may allow 16-year-olds to participate without parental consent)
Must comprehend English or other language for which there is a team member fluent in that language and consent forms are available. The study will have at least one Spanish-speaking team member and all forms will be available in Spanish.
Driver Exclusion
Operating a commercial vehicle and is actively working
Severely intoxicated and those unable to provide consent. The study has an impaired driver protocol in place to assist drivers in getting home or other destination safely if they are deemed too intoxicated to drive.
Sought out the survey to participate (e.g., heard about study through friends or relatives who just participated and wants the incentive).
Study 1 ORU Recruitment Procedures
ORUs who pass nearby the data collection location will be approached and greeted by the designated data collector. The data collector will briefly describe the study and request their participation. ORU flow rates could vary greatly depending on the data collection location. The recruitment approach will use the same methods as the driver portion of the study with as many ORUs as possible recruited when a data collector is available. If a group of ORUs is traveling together, all will be presented with the opportunity to participate to the extent a data collector can process multiple participants at once, or the ORUs are willing to wait. A table and folding chairs will be provided to allow ORUs to sit while completing the study activities.
ORU Inclusion
In transit on or near the selected roadway using some form of transportation other than a passenger motor vehicle as their main mechanism of travel
At least 18 years old (some States may allow 16-year-olds to participate without parental assent)
Must comprehend English or other language for which there is a team member fluent in that language and consent forms are available. The study will have at least one Spanish-speaking team member and all forms will be available in Spanish.
ORU Exclusion
Severely intoxicated and unable to provide consent. The study has an impaired ORU protocol in place to assist ORUs in getting home or other destination safely if they are deemed too intoxicated to safety navigate the roadway.
Sought out the survey to participate (e.g., heard about study through friends or relatives who just participated and want the incentive).
Once confirmed eligible, ORUs will provide consent and proceed through the data collection protocol as described below.
Study 1: Data Collection Procedures
Once a driver or ORU has been recruited and enters the data collection area, they will experience a similar flow through the study tasks. Figure 3 provides a visual of this flow.

Participant Flow
Once the driver has parked or the ORU has preliminarily agreed to hear more about the study, the researcher will introduce themselves and ask the potential participant if they would like to voluntarily participate in a research study. If the potential participant agrees to continue, the researcher will provide a brief summary of the study, ask the eligibility questions, and answer any questions the participant may have prior to continuing to the consent form. Each study team will include a Spanish-speaking data collector and all forms will be available in Spanish and English. Each participant will be handed the tablet with consent form for them to read. The data collector can read the consent aloud if needed and will answer questions the participant may have. If the individual agrees to participate, they will tap the appropriate box on the tablet and data collection will begin.
The breath sample will be collected first. The data collector will enter the participant ID into a preliminary breath test (PBT) device and explain to the participant how to properly blow into the PBT. A new breath tube will be opened in front of the participant and inserted. The participant will then blow into the device. The results of the test will be masked so neither the researcher nor the participant can see the result during data collection. The masking will be done through firmware that prevents the result from being displayed. The breath tube will be removed from the device and thrown away.
The data collector will open an unused oral fluid collection kit. The data collector will then explain to the participant how to place the fluid collection pad in the mouth and that it takes 3 to 5 minutes for the pad to absorb enough saliva. The participant will complete the surveys on the tablet while waiting for the oral fluid specimen to be fully collected. Once the participant is finished, the pad will be sealed in a tube containing a stabilizing buffer solution. The data collector will scan the barcode on the tube using the tablet once the participant has completed all surveys. The data collector will place the sample in storage while the participant finishes the surveys. It is expected to take up to 10 minutes for a participant to complete all study activities.
The incentive will be provided once data collection activities are complete. The participant will be thanked for their participation and provided with instructions on how to safely leave the data collection location. The information sheet describing the study with contact information will be given to participants if more information is requested.
Conversion Protocol
Some potential participants will decline to participate after they enter the data collection area. When this occurs, data collectors will ask drivers and ORUs who initially decline to participate if they would be willing to reconsider their decision by offering the driver an additional $20 incentive (up to $100 total incentive). This approach worked well in the 2013-2014 NRS as roughly 34% of refusals ultimately agreed to participate. For a participant to be considered a “conversion” and receive the additional incentive, the participant must provide breath and oral fluid samples. Participants who still decline to participate after being offered the additional incentive will be directed out of the data collection area. A study information sheet will be provided.
Impaired Driver/Person Protocol (IDP/IPP)
There will be times when a participant is deemed too impaired to participate (i.e., cannot provide consent because they are too intoxicated to understand the risks and benefits of participation) or the data collector is concerned the person may represent a hazard on the roadway even if they are able to participate in the study. In these instances, the data collector will call over the survey manager to assist with determining whether the IDP/IPP should be implemented. The study team will closely follow the IDP/IPP to make sure the participant gets to their next location safely. This applies to drivers and ORUs. The data collection team will offer safe transportation alternatives to the next destination for any individual who shows obvious signs of impairment and is deemed unsafe to drive or use their other mode of transportation.
Traffic Counts
The study will use a video camera or other traffic counting device to record vehicles passing by the data collection locations for the entirety of the data collection period. The device will be placed on a tripod or other mount in a manner that will record multiple lanes of traffic for later processing. The device will be placed well before the entry to the data collection site to avoid recording the drivers who participate. The device will only be used for counting vehicles – no identifying information such as license plate numbers will be recorded in the study database. The traffic counts will be used as part of the weighting of prevalence data.
Study 2: Feasibility Assessment ORU Recruitment Procedures
Given the exploratory nature of this study, a variety of recruitment approaches will be tested to determine which protocol results in optimal recruitment of participants. The research team will use various combinations of fixed locations similar to the driver recruitment in Study 1, roaming data collectors within a “zone,” and a variety of study team sizes depending on flow rates. Various signage types, flyers, and verbal recruitment approaches will be tested.
Study 2: Feasibility Assessment ORU Data Collection Procedures
Once an ORU has been recruited, it is anticipated the data collection procedures will mirror those of the ORU data collection for Study 1 described above. ORUs will complete the consent process, provide a breath specimen, provide an oral fluid specimen, and receive compensation. The same conversion protocols and IPPs will be in place. The study will explore a variety of possibilities for counting ORUs to determine the best method for gathering accurate counts to be used in the weighting of prevalence data if a large-scale national study were to be deemed feasible. It is expected to take up to 10 minutes for a participant to complete all study activities.
B.3 Describe methods to maximize response rates and to deal with issues of nonresponse.
The two studies will use highly trained teams of data collectors to implement the recruitment procedures described above. The recruiting procedures have been used with great success in past NRSs. The study will offer financial incentives for participation. The studies plan to pay $20 to participants who complete all data collection activities. The studies plan to utilize the conversion protocol described earlier when a potential participant enters a data collection area, but initially declines to participate. The incentive will be increased up to $100 in increments of $20. If a driver or ORU still declines to participate, the data collector will observe and record their best estimate of the person’s age, sex, race, and vehicle type/method of transport. As previously noted, information collected for participants and nonparticipants at each stage of selection will be used to assess potential biases due to differential participation, and to make appropriate weighting adjustments if necessary.
Additionally, the researchers will provide assurances of confidentiality in the informed consent process by indicating that no identifying information will be recorded by the project. The study plans to seek a Certificate of Confidentiality from the National Institutes of Health to provide further assurances to participants.
B.4. Describe any tests of procedures or methods to be undertaken. Testing is encouraged as an effective means of refining collections of information to minimize burden and improve utility. Tests must be approved if they call for answers to identical questions from 10 or more respondents. A proposed test or set of tests may be submitted for approval separately or in combination with the main collection of information.
The protocols for recruiting drivers and collecting information have proven effective in past NRSs and are expected to perform well in Study 1. Adding ORU recruitment to Study 1 will require some minor modifications that will need to be tested to make sure the study teams can implement them as intended. The study will provide training to all data collectors and pilot test all protocols for data collection. Pilot test results will be used to identify potential improvements to the protocol prior to beginning actual data collection.
Study 2 exploring the feasibility of conducting a roadside survey focusing solely on ORUs will test a variety of procedures to find the optimal approach for conducting a study of this type. A description of the success or failure of each protocol will be provided to NHTSA to help the agency decide whether a roadside survey of only ORUs is worth pursuing in the future.
B.5. Provide the names and telephone numbers of individuals consulted on statistical aspects of the design.
The following individuals have reviewed technical aspects of this research plan:
Amy Berning, MA
National Highway Traffic Safety Administration
Department of Transportation
1200 New Jersey Avenue SE. Washington, DC 20590
Office: 202-366-5587
Randolph Atkins, PhD
National Highway Traffic Safety Administration
Department of Transportation
1200 New Jersey Avenue SE, Washington, DC 20590
Office: 202-366-5597
Kraig Finstad, MA, PhD
Dunlap and Associates, Inc.
125 Edinburgh South Drive, Suite 111, Cary, NC 27511
Office: 203-323-8464
A. Scott Tippetts
Pacific Institute for Research and Evaluation (PIRE) – National Capital Region
4061 Powder Mill Road, Suite 350; Beltsville, Maryland 20705-3113
Office: 470-326-8267
Jay Breidt, MS, PhD
National Opinion Research Center at the University of Chicago
Department of Statistics and Data Science
4350 East-West Hwy, 8th Floor
Bethesda, MD 20814
Office: 970-214-7171
F. Dennis Thomas, MA, PhD
Dunlap and Associates, Inc.
125 Edinburgh South Drive, Suite 111, Cary, NC 27511
Office: 203-215-2948
Jenna
Darrah, MS
Dunlap and Associates, Inc.
125 Edinburgh South Drive, Suite 111, Cary, NC 27511
Office: 412-965-9889
1 The Abstract must include the following information: (1) whether responding to the collection is mandatory, voluntary, or required to obtain or retain a benefit; (2) a description of the entities who must respond; (3) whether the collection is reporting (indicate if a survey), recordkeeping, and/or disclosure; (4) the frequency of the collection (e.g., bi-annual, annual, monthly, weekly, as needed); (5) a description of the information that would be reported, maintained in records, or disclosed; (6) a description of who would receive the information; (7) if the information collection involves approval by an institutional review board, include a statement to that effect; (8) the purpose of the collection; and (9) if a revision, a description of the revision and the change in burden.
2 Wolfe, A. C. (1974). 1973 U.S. National Roadside Breath Testing Survey: Procedures and results. Ann Arbor, MI: University of Michigan Safety Research Institute.
3 Zhang, F., Noh, E. Y., Subramanian, R., & Chen, C.-L. (2019, May). Crash Report Sampling System: Sample design and weighting (Report No. DOT HS 812 706). Washington, DC: National Highway Traffic Safety Administration
4 Zhang, F., Subramanian, R., Chen, C.-L., & Noh, E. Y. (2018, March). Crash Report Sampling System: Design overview, analytic guidance, and FAQs (Report No. DOT HS 812 509). Washington, DC: National Highway Traffic Safety Administration.
5 National Center for Statistics and Analysis. (2018, March). Police-reported motor vehicle traffic crashes in 2016. (Research Note Report No. DOT HS 812 501). Washington, DC: National Highway Traffic Safety Administration.
6 Streetlight Data (2022b). StreetLight Pedestrian Volume Methodology and Validation. White Paper. https://learn.streetlightdata.com/hubfs/White Papers/Ped Metrics Methodology, Data Sources, and Validation/StreetLight Pedestrian Volume Methodology and Validation White Paper - June 2022.pdf
7 Streetlight Data (2022a). Bike Metrics Methodology, Data Sources, and Validation. White Paper. https://learn.streetlightdata.com/hubfs/White Papers/Bike Metrics Methodology, Data Sources, and Validation/StreetLight Bicycle Volume Methodology and Validation White Paper - June 2022.pdf
| File Type | application/vnd.openxmlformats-officedocument.wordprocessingml.document |
| File Title | NRS Part B May 2024 (5-9) |
| Author | Atkins, Randolph (NHTSA) |
| File Modified | 0000-00-00 |
| File Created | 2025-09-23 |
© 2026 OMB.report | Privacy Policy